Graph information
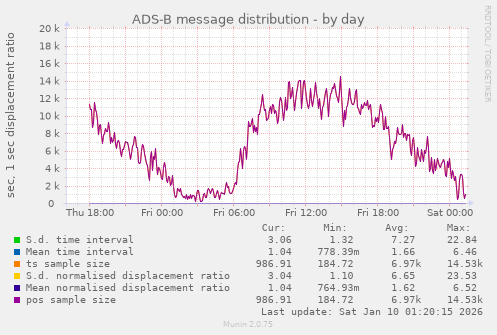
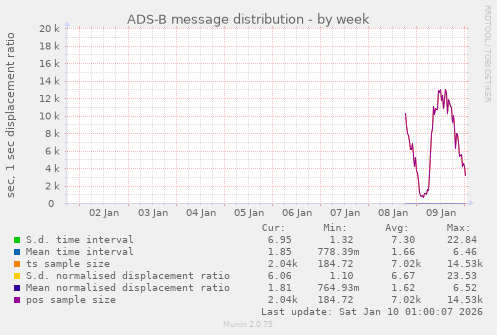
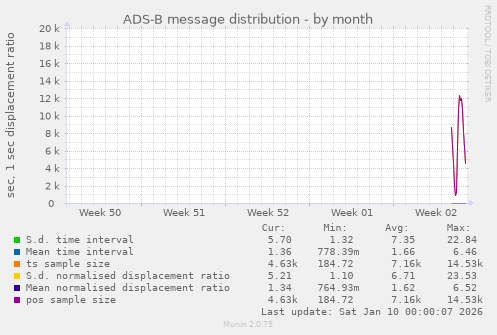
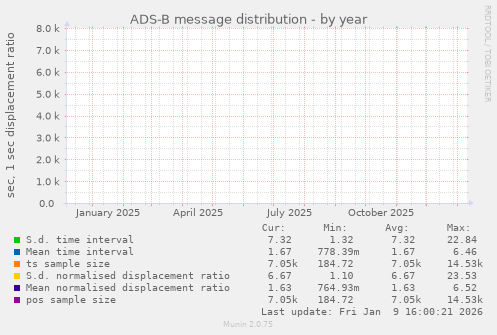
This graph shows signal timing consistency. Lower Jitter (StdDev) is better.
| Field | Internal name | Type | Warning | Critical | Info |
|---|---|---|---|---|---|
| Time Interval StdDev | ts_sd | gauge | |||
| Time Interval Mean | ts_mean | gauge | |||
| Position Jitter StdDev | pos_sd | gauge | |||
| Position Jitter Mean | pos_mean | gauge |
Zooming is very easy, it's done in 3 clicks (regular clicks, no drag&drop):
- Click to define the start of zoom.
- Click to define the ending of zoom.
- Refresh.
You can use the interactive form too.